 MicroWorlds for Advanced Beginners - Probability
© 1998 Gary S. Stager
Now that most of you can be considered advanced beginners in using MicroWorlds,
this issue will explore a bit more of the language and data structures. This
activity will explore probability while demonstrating how sliders, text boxes
and even the screen may be used to collect and report data.
The core of this project will flip a coin numerous times and record number of times heads and tails appear.
- Start a new project.
- Name the turtle, coin.
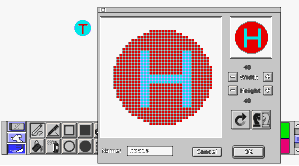
- Create two coin shapes in the shapes center. Name one heads and the other tails. Be sure to make them appear different in some way so that the user can clearly see which one side of the coin lands face-up.
- Change the turtle's costume to one of the coin shapes.

Create a Many Times button with the instruction, flip.
Recording data with text boxes
This part of the project will flip a coin in FLIP, and change the value in the textboxes, headscount, tailscount and totalflips. If you name turtles, text boxes or sliders with you unique names, you may change them even if they are on different pages. This allows you to have some action going on between the scenes.
- Make a startup button on the first page.
- Create a new page from the pages menu.
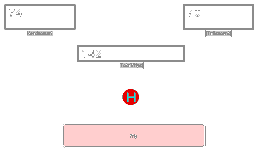
- Create text boxes named, Headscount, Tailscount and Totalflips.
- Show the names of the text boxes so the user knows what they are reading.
- Click the Startup button
- Type the following procedures on the procedures page.
to flip
ifelse coin = "heads [recordheads] [recordtails]
settotalflips totalflips + 1
end
to coin
if 1 = random 2 [output "heads]
output "tails
end
to recordheads
coin, setsh "heads
setheadscount headscount + 1
end
to recordtails
coin, setsh "tails
settailscount tailscount + 1
end
to startup
everyone [settext 0]
end

Click the flip button to start and stop the experiment.You may wish to make the flip button run Many Times if you want it to keep flipping the coin.
Recording data with sliders
Sliders may be used as reporters (input devices) to change the value of a variable or they may be used as indicators (output devices) displaying the current value of that reporter. Let's experiment with sliders on a second page of our coin flipping project.
- Create a new page from the Pages menu.
- Create two sliders, heads and tails, with a minimum of 0 and maximum of 300 at the bottom of the new page.
- Optional: Create buttons to switch between the two pages of our project.
- Make the following changes to your procedures.
to recordheads
coin, setsh "heads
setheadscount headscount + 1
setheads heads + 1
end
to recordtails
coin, setsh "tails
settailscount tailscount + 1
settails tails + 1
end
to startup
settailscount 0
setheadscount 0
settotalflips 0
settails 0 setheads 0
end
Type Startup to initialize the variables, click on the flip button and switch between pages.
Do you see the sliders changing their values?
Extra bonus!
Adding a histogram to graph our data.
It is easy to add simple graphing functionality to our probability lab with the creation of two turtles and a bit more Logo programming.
- Hatch two turtles on the same page as the sliders.
- Name one turtle, headsgraph, and the other, tailsgraph. (for heads graph and tails graph)
- Place those turtles above their respective sliders.
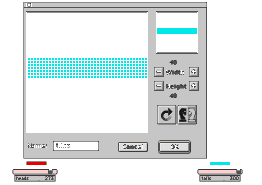
- Create two different turtle costumes consisting of blue and red horizontal bars. Name the shapes hline and tline.

Make the following changes to your procedures.
to recordheads
coin, setsh "heads
setheadscount headscount + 1
setheads heads + 1
headsgraph, fd 1 stamp
end
to recordtails
coin, setsh "tails
settailscount tailscount + 1
settails tails + 1
tailsgraph, fd 1 stamp
end
to startup
settailscount 0
setheadscount 0
settotalflips 0
settails 0 setheads 0
headsgraph, setpos [-170 -145]
tailsgraph, setpos [200 -145] page2 clean page1
end
Type Startup and click on the flip button to set the experiment in action!
You may even want to figure out a way to stop the graphing when a bar reaches the top. How about a textbox reporting the experimental standard deviation?

The magic of MicroWorlds' parallelism allows the coin to be animated, text boxes to change, sliders to report and a histogram to be created all at once. You can use lots of software to generate random numbers, but no other title allows all of these things to happen at once. I am confident that you can figure out exciting ways to integrate these programming techniques into much more complex simulations and experiments.
|


